Hvor går markederne hen?

Er der andre, der er nervøse for CPI-tallene i morgen?

Det ser ud til, at hele markedet forventer et fald på eller under forventningerne til inflation. Jeg er lidt bekymret for, at kerneinflationen kan overraske på opsiden, pga de forsinkede effekter i husleje og boligpriser.

1 Synes om

Jeg tror vi kommer til at se en kraftig reaktion både torsdag og fredag, næsten uanset hvad tallene viser. Den “rigtige” og mere objektive reaktion, tror jeg først vi ser i starten af næste uge, når tallene er blevet “slugt og fortæret” …faktisk tror jeg lidt på en positiv reaktion i næste uge, når markedet måske endda vedtager med sig selv, at rentestigningen i starten af februar måske kun bliver på 0,25% - måske er det bare ønsketænkning fra min side :slight_smile:

1 Synes om
  • US. Dec. CPI out at -0,1% MoM and +6,5% YoY
    vs. -0,1% / +6,5% expected, respectively, and 7,1% YoY in Nov.

  • US. Dec. CPI ex. Food and Energy out at +0,3% MoM and +5,7% YoY
    vs. +0,3% / +5,7% expected, respectively, and vs. 6,0% YoY in Nov.

Hej Paul, jeg syntes, det var interessant, at markederne oprindeligt solgte fra på grund af nyhederne, men nu har drevet markederne højere. Alt i alt tror jeg, at dataene, der lever op til forventningerne, vil være positive for markederne, hvad tror du?

1 Synes om

Jeg er enig - jeg tænker vi faktisk står foran en god solid optur - det er mit gæt (og jeg understreger “gæt”) - næste uge bliver spændende, for der tror jeg først tallene vil bundfælde sig - og så vil man begynde at spekulere i en mindre rente forhøjelse end tidligere forventet i starten af februar måned … og Kina vil begynde at starte motorerne igen - men Putin kan tilgengæld ødelægge det hele …

Hvis den store (aktie) optur nu pludselig brager løs (i næste uge), skal vi dog huske at der sikkert er mange der ret hurtigt vil tage gevinst hjem. Så opturen kommer vel i bidder / sekvenser - og usikkerheden vil helt sikkert stadig spøge i baggrunden … bumpet vej ?

1 Synes om

Synes også der har været lidt stille fra østen den seneste stykke tid, så bliver meget spændende om enten Rusland eller Kina, kommer til at melde enten det ene eller andet ud i den kommende fremtid :thinking: Det kommer uanset hvad til at have en effekt på markedet…

Hej Paul,

Jeg tror bestemt, at momentum er på din side. Jeg tror, ​​at rentehistorien vil fortsætte med at drive markederne fremad. Det andet positive er, at BNP ser ud til at være stærkere end forventet, hvor Tyskland og Storbritannien rapporterede tal her til morgen. I øjeblikket ser sandsynligheden for en blød landing ud til at være stigende, hvilket bestemt er positivt for markederne.

Der er et par ting, jeg holder øje med i den næste periode.

Den første er energipriserne. Faldende energipriser virker som en form for stimulans, der øger forbrugernes disponible indkomst og gavner virksomhederne på samme måde. Lige nu ser energisituationen i Europa positiv ud, og lageret er fortsat højt. Men effekten af ​​Kinas genåbning er stadig usikker. Indtil videre i 2023 er oliepriserne steget markant, og det tror jeg bliver interessant at blive ved med at følge.

Den anden ting, jeg ser, er indtjeningshistorien. Jeg er interesseret i at se, hvordan de amerikanske banker rapporterer i eftermiddag, og i særdeleshed, om de øger deres hensættelser til tab på debitorer, og i givet fald med hvor meget.

(PS, how is my Danish? I had a little help from translate :slight_smile: )

Hej Philip :slight_smile:

Dit dansk er super fint !
… og meget bedre end mit engelsk hehehe

You are very kind, hopefully it can keep improving :smiling_face:

1 Synes om

I have been following the conversation around the BOJ’s rate hike decision and wanted to write a post, it would be great if people give it a read and share any thoughts - please reply in Danish :slight_smile:

Why are markets watching the BOJ?

The Bank of Japan (BOJ) will make its latest interest rate policy decision overnight (04:00 CET), giving markets an answer to this week’s speculation. Many market participants suggest tonight’s decision will end the BOJ’s yield curve control (YCC) experiment, which has governed the country’s interest rate policy since 2016, in a dramatic conclusion. The BOJ faces a catch-22, forced to choose between its currency or its bond market. Below I share my take on how it got here and what it means for markets.

A brief history of YCC

Japan first began yield curve control in 2016 to encourage investment and raise inflation to combat falling prices. The BOJ capped the yield of 10-year Japanese Government Bonds (JGBs) at around 0% to encourage borrowing, promising to buy JGBs if the value of the bonds fell such that yields (which move inversely to price) rose above 0%, thereby backstopping its sovereign bond market.

Since 2016 the BOJ was largely successful at capping JGB yields around its target, pinning down borrowing costs but driving investors away from the JGB market due to the low volatility. However, the policy has been slow to drive inflation in Japan and has instead encouraged much investment overseas as a result of the higher interest rates attainable outside of Japan, e.g. in the US. The low bond yields in Japan encouraged Japanese investors to pursue higher returns abroad, with @LukeGromen suggesting yesterday that Japan has accumulated USD 3.2tn of foreign assets, of which USD 1.1tn are of US Treasuries. Another consequence of the YCC was to encourage international investors to borrow in Japanese yen at low/zero interest rates and use the money to earn a yield abroad (e.g. in the US) in what is called a carry trade.

The systematic leverage created through carry trades contributes to why tonight’s meeting is being so closely followed by Wall St. That is because to execute a carry trade, investors must also hedge their currency exchange risk, and that becomes increasingly expensive as Japanese interest rates rise and currency prices become more volatile.

So, when the BOJ raised its YCC target last month on the 10-year JGB from 0-0.25% to 0-0.50%, markets, to fight (finally) rising Japanese inflation and a weakening currency, markets were shocked. The move, first of all, showed markets the BOJ’s commitment to its target has weakened, but maybe more importantly, changed the incentives for Japanese investors and carry traders.

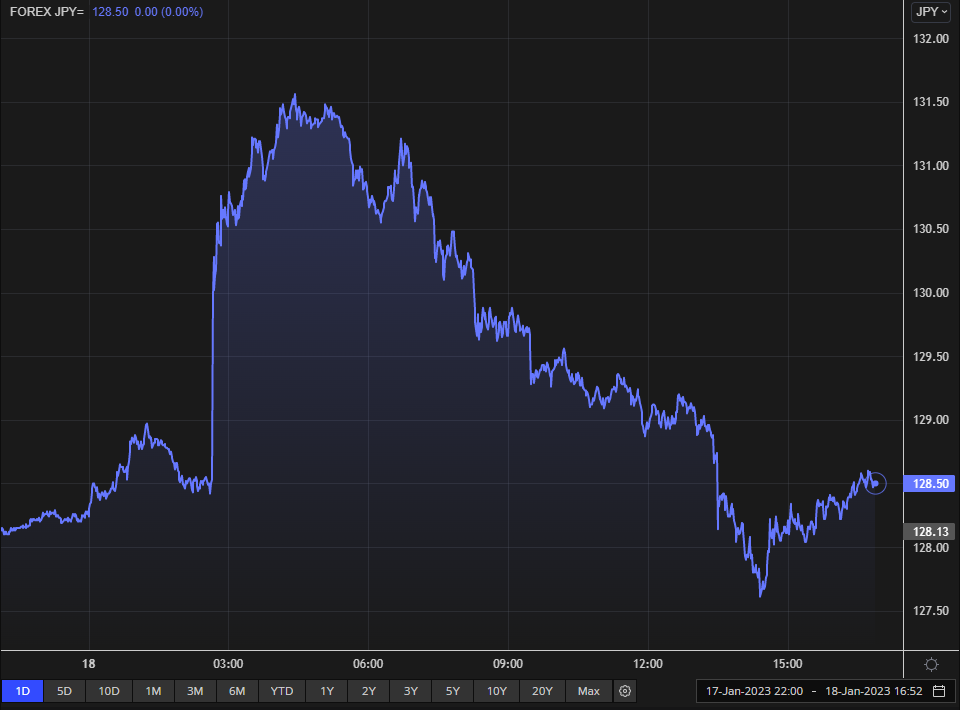
For the first time in a long time, Japanese investors could earn a yield at home, while carry traders were looking at a significantly less profitable trade (due to a lower interest rate differential and increased FX hedging costs). The BOJ’s 20 December 2022 decision has seen the Japanese yen appreciate against the dollar as investors sell dollar-denominated assets to acquire Japanese-denominated ones (Sell USD to buy JPY).

The BOJ at a crossroads

However, as a result of the BOJ’s surprise hike to its interest rate boundary, markets have lost confidence in the central bank’s commitment to its yield curve control, which has inspired hedge funds to make speculative bets that the BOJ will hike this boundary further. And in the month since its policy change, the BOJ has spent over USD 150bn to defend its new interest rate cap, with markets breaking through the boundary on both Friday, 13.01.23 and Monday, 16.01.23.

Therefore the BOJ finds itself in a precarious position where it has a choice to either keep defending its yield cap, printing money to keep up with the growing bond purchases necessary to defend its position at the expense of its currency’s value, and risking runaway inflation; or giving into markets and increasing the yield cap further, reducing the value of its JGB values (since rising yields means lower price), and potentially creating a Liz Truss style crisis among Japanese pension funds and insurance companies.

If the BOJ lets its YCC boundary increase further (gives into markets), the yen will likely surge, sending the dollar lower as carry trades globally are unwound. If the BOJ maintains its YCC target, the yen could fall as the BOJ will either have to print increasing amounts of currency or start selling its foreign assets to defend its currency.

I see no good options for the BOJ. I am interested to hear opinions on what people think they will do and what both options mean for Nordic markets.

(again, please reply in Danish)

The BOJ held strong on its new boundary!! The BOJ maintained its 0-0.5% yield target on 10-year JGBs.

For anyone who followed the market reaction today, I thought it was fascinating to see that the first reaction was for the JPY (yen) to sell off against the USD and other major currencies. But the European close USD/JPY is back where it started with the JPY actually strengthening vs the dollar during the day. See graph below.

I think this is super interesting because it shows the trend I outlined yesterday of “repatriation”. Japanese investors are moving capital back to Japan because of the favourable yield (when accounting for FX hedging), and some hedge funds are starting to unwind their carry trades (Sell dollar assets to return loans denominated in JPY).

Markets still believe that with inflation rising in Japan, the BOJ has its hands tied and will, at some point, be forced to raise its boundary again, which will further accelerate the above conditions.

Below I have collected some of my favourite threads on the topic from today - enjoy :slight_smile:

2 Synes om

Så alle PPI-dataene i dag?

STOR MISS PÅ US PPI
PPI -0,5 %, M/M, Exp. -0,1 %
PPI 6,2 % % å/å, eksp. 6,8 %

PPI har været førende forbrugerpriserne med ca. 1-måned som vist af Andreas Steno nedenfor.

Dataene i dag tyder på, at inflationen fortsætter med at falde, og det gør Feds arbejde meget lettere. Det er godt for markederne, ikke??

Alt andet lige ja, men det vil afhænge af indtjening og arbejdsløshed fremover. Hvad synes i?

Yesterday markets received a boost as Fed Chair Powell delivered his speech without pushing back against the market’s recent rally, which has also seen Treasury yields, particularly at the long end, come down significantly. Markets are pricing a less hawkish rate hiking cycle than the Fed’s messaging signals so Powell’s lack of pushback saw markets gain on expectations of easier policy from the Fed, resulting in improved liquidity conditions.

For most of 2022, liquidity conditions were the driving force in markets, with 2023 starting on the same track as the Nasdaq has gained despite falling earnings expectations as multiples have expanded.

While markets have focused on forward guidance from the Fed to predict the future direction of markets, it is not only the Fed which can affect liquidity conditions. The US Treasury also plays a role through either building or depleting its Treasury General Account (TGA), which operates at the Treasury’s current account at the Federal Reserve.

The recent market rally can be traced back to October 2022, coinciding with the Treasury initiating a TGA drawdown. The below chart measures US financial conditions, broadly understood as liquidity conditions, showing a general improvement since October 2022. Some macro analysts have suggested that this action has been a major influence behind the rally and that understanding how the TGA affects liquidity may help understand future market behaviour.

The following chart shows the TGA account with a broadly similar trend and highlights a drawdown from around October 2022. So did the US initiate a back-door pivot in October, and what can we expect from the TGA moving forward.

To understand the TGA’s effect, we must understand liquidity as a function of bank reserves. When bank reserves increase, the banking system’s availability of funds for lending and investment increases and liquidity conditions improve, and when bank reserves fall, liquidity conditions worsen. This is how QE and QT affect financial conditions.

During QE, the Fed purchases Treasuries and other securities from banks using “printed” money, injecting capital into the banks and increasing bank reserves (The Fed transfers money to the banking system).

During QT the Fed sucks reserves out of the banking system by collecting principal payments on expiring Treasuries and securities and not reinvesting the proceeds, in turn reducing bank reserves (The banking system transfers money to the Fed).

The Treasury General Account (TGA) does not directly affect the Federal Reserve balance sheet, but whether it is increasing or decreasing affects the flow of money and the level of bank reserves.

Given that the TGA is equivalent to the Treasury’s current account, when the TGA is decreased, the Treasury is drawing on its check-in account to inject money into the economy. The Treasury uses balances in its TGA to pay for government expenditures, e.g. pay government employee wages. The payment of government employees and government contracts ultimately increases US citizens’ bank deposits, increasing the banking system’s reserves.

When the TGA is accumulating, the Treasury sells excess Treasuries (issues more government debt than its spending requires). The banking system purchases the Treasury issuance, resulting in the banks having less available capital to spend on other assets e.g. risk assets. The excess sale of Treasuries (issuance > government spending) locks up capital from the banking system and reduces liquidity.

What’s next for the TGA, and what does it mean for markets?
A major reason for the TGA drawdown has been the US debt ceiling limit. The debt ceiling limit restricts the Treasury’s ability to issue new government. (The Treasury can use extraordinary measures to sustain issuance for a limited time after reaching the debt limit, which Treasury Secretary Yellen expects can stretch until June)

The debt ceiling increases the likelihood that the TGA downtrends towards zero until an agreement to increase the limit is reached. The relationship between the TGA and market liquidity is imperfect, but the TGA drawdown may explain some of the rally since October. It will be interesting to follow its development and potential refilling after an agreement on the debt ceiling. I will try to post updates on the topic as events unfold.

1 Synes om

What’s happening with Silicon Valley Bank (SVB), and what does it mean for Danish banks and Danish markets?

What’s happening at Silicon Valley Bank (SVB)?

SVB, which services clients in venture capital and private equity, is facing liquidity issues as clients are withdrawing deposits, with Peter Theil’s Founder’s Fund advising startups to withdraw liquidity.

The panic arose after Silicon Valley Bank announced it was raising equity to recapitalise following realised losses on a bond portfolio sold to cover deposit requests.

SVB announced it had faced deposit withdrawals as clients needed their money after burning through their funding. There is also another dynamic, particularly present in the US, that firms and individuals can earn a 4%+ yield on cash holdings in money market funds, which is significantly higher than what is available at banks (including SVB), creating an incentive for withdrawals.

SVB has faced significant deposit withdrawals, and in order to meet its withdrawal requests, it was forced to sell its liquid assets, which included a USDbn 21 bond portfolio with a yield of 1.79% and duration of 3.6 years. SVB announced it would book after-tax losses of USD 1.8bn following the sale of said liquid assets.

Breaking that down further, the bank was earning a stable yield of 1.79% on its bond portfolio for a duration of 3.6 years. But with the Fed’s policy rate at 4.5-4.75%, that yield is comparatively unattractive. If SVB had held the portfolio to maturity, it would have meant earning a lower yield than what was available in the market. However, because it was forced to sell the portfolio, it was forced to sell at a discount in order to compensate a buyer for the lower yield, and that created a realised loss for SVB.
Following the loss, the bank was forced to raise new equity to cover the loss and restore its capital ratios necessary to meet regulation. The need for equity signalled to customers and the market that the bank was scrambling for liquidity and was distressed, which exacerbated the pressure on withdrawals because the one rule during a bank run, is don’t be last.

The future for the bank is still uncertain, and its share price is down a further 44% pre-market open (listed in the US), and more importantly, it has got markets thinking about which other banks hold unrealised losses which they may be forced to realise to shore up liquidity.

What does this mean for Danish Banks?

It’s important to stress that this is not 2008, the situation this time around is different, and the banks are far better capitalised. For example, the below tweet highlights that in 2008, many banks were operating with low single-digit tier 1 capital ratios, LTV’s > 100%, and held risky portfolios. However, in 2023 Danish Banks have tier 1 capital ratios in the mid-teens to mid-20s, and less risky holdings.
This is to say that right now, markets are expecting the SVB situation to remain isolated to the VC / PE sector and contained within US markets, and overall the direct impact on Danish / Nordic banks should be minimal, with fear being the driving force behind share price losses over the past few days.

Disclaimer the views in this post are my own, and nobody else’s, and this is not financial advice.

Disclaimer: HC Andersen Capital receives payment from a number of Danish banks for a digitalIR/corporate visibility subscription agreement.

Agree this should be pretty easy to isolate, and the read over to Nordic banks are very small directly,

But it need to contained, as the unrealized loses are pretty big in the US banks (ouside the balance sheet on held to maturity assets). No problem as long it’s keept at the Hold to maturity, and that is possible if deposit is stable, so no more bank-run in other banks.

Ore else it could raise risk premiums in global banks and for that matter also on equities globaly, remember part of the risk premium size is trust, and if that gets lost, it affect all asset.

So really keep an eye out that either another bank buys SVB monday ore tuesday, ore they act so fast that most of deposit are coveres by an asset fire-sale very fast.

this is scary stats

in for the people who read that SVB is a special case with 97% not covered by the FDIC insurrance . That is not uncorrect but large banks are not that far behind, so… so this need to contained fast…

I have highlighted some of the newest development this morning as reported by Jennifer Schonberger from Yahoo Finance. Last week ended with the worst day for bank stocks since the financial crisis of 2008, but what now?

U.S. government guarantees all Silicon Valley Bank deposits, money available Monday

As @michaelfriis said, a Treasury official noted the government did seek bids for Silicon Valley Bank’s assets, but officials opted not to proceed with an auction given the fluidity of the situation.

“After receiving a recommendation from the boards of the FDIC and the Federal Reserve, and consulting with the President, Secretary Yellen approved actions enabling the FDIC to complete its resolution of Silicon Valley Bank, Santa Clara, California, in a manner that fully protects all depositors.”, FDIC said.

Signature Bank seized

In their joint statement, regulators also announced a similar systemic risk exception for Signature Bank, which was closed on Sunday by its state chartering authority. All depositors of this institution will be made whole. As with the resolution of Silicon Valley Bank, no losses will be borne by the taxpayer.

Features are up… But… We are not in the clear yet.

The general consensus seems to be that we should still expect a market volatility which is extremely high the coming period - banks are still under a tremendous pressure. Features are currently up between 0.2-0.6%, which was much higher late sunday night DK time where they peaked between 1.6-1.8%.

JPM’s udsigt til S&P500 reaktion, når månedens Consumer Price Index (CPI-tal) frigives senere i dag.

1 Synes om

S&P 500’s Bullmarked: En blandet pose for os investorer?

Hej alle,

Jeg tænkte på at dele nogle spændende observationer om den nuværende situation for S&P 500. Selvom vi er lige ved indgangen til et bullmarked, ser det ikke ud til, at alle investorer er klar til at hoppe med på den mulige opadgående bølge.

Nylige data fra CFTC’s Commitments of Traders-rapport, som er analyseret af Bespoke, viser en overraskende tendens. S&P 500 futures er i øjeblikket 17,4% short, hvilket er den største short position siden september 2007.

Derudover er S&P 500 på en langsom og stabil opstigning, og det tager sin tid at nå et fuldt udviklet bullmarked. Denne hastighed er den langsomste, vi har set siden perioden 1957-1958, ifølge Bespoke.

Denne gradvise stigning og den bemærkelsesværdige short position har skabt en del forskellige meninger blandt markedets strateger om, hvad der mon kommer til at ske med indekset fremadrettet. Det er en ret interessant situation, og jeg ville virkelig sætte pris på at høre, hvad I tænker om, hvad der kunne være i vente.

God investering til os alle!

Jeg ville dele nogle indsigter om den aktuelle tilstand af S&P 500. Det ser ud til, at vi er kommet ind i det, der omtales som et bull-marked. For dem, der er nye til disse udtryk, betyder et bull-marked en periode, hvor indekset er steget 20 % eller mere fra dets seneste low. Dette ret så særlige bull-marked startede den 13. oktober 2022, lige efter S&P 500 lukkede på et lavpunkt på 3.577,03​1​.

Økonomien har overraskende holdt stand og er ikke faldet ind i den forventede recession. På trods af inflationsfrygt sidste år og Federal Reserves aggressive tiltag (som at hæve renten til det højeste niveau siden 2007), er økonomien forblevet robust, hovedsageligt på grund af et stærkt arbejdsmarked. Inflationen er også faldet siden toppen sidste sommer, hvilket giver håb om en ende på renteforhøjelserne​.

Det interessante er, at Dow Jones Industrial Average og Nasdaq allerede kom ind i bull-marked i henholdsvis november og maj​. Dog er Federal Reserve måske ikke færdig med at hæve renten endnu. Der er en forventning blandt analytiker om, at renteforhøjelserne genoptages i juli, selvom en vedvarende inflation kan ændre denne situation​.

Det er værd at bemærke, at de fleste af S&P 500’s gevinster i år er kommet fra en lille gruppe aktier som Apple, Microsoft og Alphabet. Dette har givet deres bevægelser ekstra vægt på indekset, mens næsten halvdelen af ​​de øvrige aktier i indekset er faldet i 2023​.

Historisk set har bull-markeder varet omkring 5 år i gennemsnit, hvor S&P 500 har oplevet en gennemsnitlig gevinst på 177,8%. Det længste tyremarked startede i marts 2009 og varede næsten 11 år​. Vores tidligere bull-markede startede den 23. marts 2020 og varede omkring 21 måneder, men stadig mere end fordoblede S&P 500​.

Dette tyremarked markerer også afslutningen på bear-markedet, der begyndte den 3. januar 2022. Bear-markedet anses for at være afsluttet den 12. oktober 2022. Selvom definitionerne kan variere, tjener dette som en nyttig markør for os som investorer. Det bear-marked, der netop sluttede, varede omkring ni måneder og oplevede et fald på 25,4%, hvilket er relativt mildt sammenlignet med det gennemsnitlige bear-marked siden 1950, som typisk varer 13 måneder med S&P 500 faldende 34,2%​.

Jeg tænkte lige, at jeg ville dele denne opdatering med jer alle. Det er altid interessant at følge disse markedstendenser.

1 Synes om